version 2.40 release notes
VRTool version 2.40 release notes (jun/15)
A couple new things for the weather inclined.
Changes:
- NOAA Module - implemented download of other weather variables
(beside winds) like pressure and temperature.
Go to NOAA module Config page to choose weather variables
to be downloaded along with winds.
Pressure is very useful for sailors, as it is the primary driver
of winds. Surface temperature is also important.
Pressure and temperature (if available) can be shown by the measure tool,
printed as wind texts or plotted as fields (see below).
Pressure is in milibars and surface temperature in deg Celsius.
- Fields - Fields visually represent a weather variable in a given area.
Fields can be made of vectors (p.e. wind arrows) or scalars represented as color gradients.
Field properties are name, opacity, smooth (on/off), resolution (cell size in degrees)
and area of coverage. Note that setting a small grid cell size covering a large area
can impact chart rendering performance ( a value of 0.2 degree for field resolution is suggested ).
While smooth color gradients look nice, non-smooth show the field contours clearly. Your choice.
This version supports the following field types: wind vectors,
wind colors, pressure colors, temperature, land coverage.
If wind interpolation is on, weather variables are also interpolated.
Rain fall is not working yet
Fields can be added and edited in the "Marks, Circles, Fields" group.
To create a field, set properties and click [Add field] .
This will add a field covering the current viewport area.
Double click a field in the listbox to edit its properties ( type, resolution,
opacity and rectangle ).
- Wind barbs - In addition to existing wind draw modes (arrow, line)
I added wind barbs, the way meteorologists are used to represent winds.
The number and length of the barbs on the tail of the arrow indicate
the wind speed in knots. Each full barb means 10 knts,
a half barb is 5 knots and a flag corresponds to 50 knts.
Wind speed is easy to figure by counting the barbs.
Differently from other wind draw modes, barbs have fixed length
and are not centered, but positioned to point the wind location.
See http://www.meteor.wisc.edu/~hopkins/aos100/sfc-anl.htm
- Wind speed decimal places (0, 1 or 2)
- Improved weather routing near land. Previous version did not
perform well around islands and capes.
- Corrected issues with grib files imported by ZyGrib and UGrib.
ZyGrib and UGrib have their own servers producing compact grib 2 files.
ZyGrib files are further bz2 compressed.
These programs save the grib files to hard disk (Gribs contain the wind forecasts and other meteorological variables).
You can load those gribs in VRTool, using the NOAA import module.
1- Click [Load] and select the file.
* For UGrib search files with extension *.grb
* For ZyGrib search files with extension *.grb.bz2
Choose the file and click [Ok].
2- Click [Use Winds]. This will add the grid to vrtool desktop.
I found these files to be useful if you are sailing on a real boat with
restricted Internet access. Downloading data directly from NOAA
servers can be difficult if the connection is slow.
Also, by re-using the files, you save satellite bandwidth.
- Fixed some small problems. While not required, this update
is recommended.
 download page
------ Screen shots ------

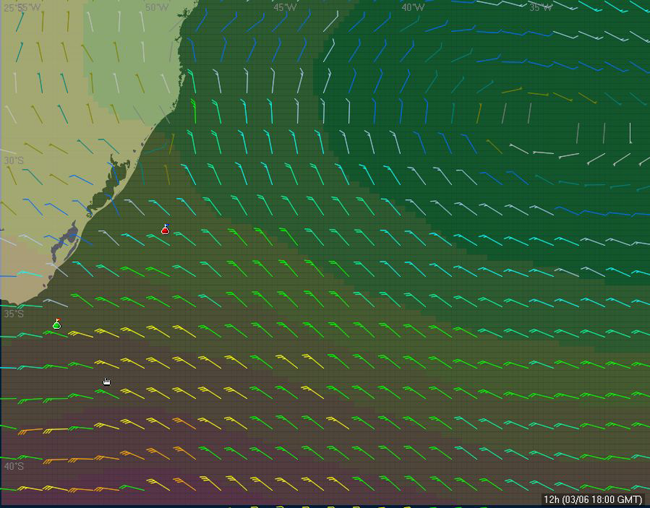
Wind color field is similar to previous colored rectangles, but with higher resolution.
Better for interpolated winds

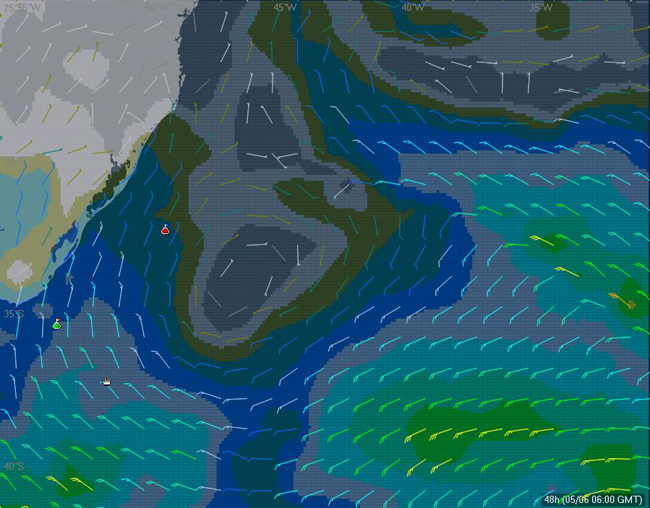
Low pressure areas (red) have fast winds. Green and blue areas are high pressures (calm)
A couple new things for the weather inclined.
Changes:
- NOAA Module - implemented download of other weather variables
(beside winds) like pressure and temperature.
Go to NOAA module Config page to choose weather variables
to be downloaded along with winds.
Pressure is very useful for sailors, as it is the primary driver
of winds. Surface temperature is also important.
Pressure and temperature (if available) can be shown by the measure tool,
printed as wind texts or plotted as fields (see below).
Pressure is in milibars and surface temperature in deg Celsius.
- Fields - Fields visually represent a weather variable in a given area.
Fields can be made of vectors (p.e. wind arrows) or scalars represented as color gradients.
Field properties are name, opacity, smooth (on/off), resolution (cell size in degrees)
and area of coverage. Note that setting a small grid cell size covering a large area
can impact chart rendering performance ( a value of 0.2 degree for field resolution is suggested ).
While smooth color gradients look nice, non-smooth show the field contours clearly. Your choice.
This version supports the following field types: wind vectors,
wind colors, pressure colors, temperature, land coverage.
If wind interpolation is on, weather variables are also interpolated.
Rain fall is not working yet
Fields can be added and edited in the "Marks, Circles, Fields" group.
To create a field, set properties and click [Add field] .
This will add a field covering the current viewport area.
Double click a field in the listbox to edit its properties ( type, resolution,
opacity and rectangle ).
- Wind barbs - In addition to existing wind draw modes (arrow, line)
I added wind barbs, the way meteorologists are used to represent winds.
The number and length of the barbs on the tail of the arrow indicate
the wind speed in knots. Each full barb means 10 knts,
a half barb is 5 knots and a flag corresponds to 50 knts.
Wind speed is easy to figure by counting the barbs.
Differently from other wind draw modes, barbs have fixed length
and are not centered, but positioned to point the wind location.
See http://www.meteor.wisc.edu/~hopkins/aos100/sfc-anl.htm
- Wind speed decimal places (0, 1 or 2)
- Improved weather routing near land. Previous version did not
perform well around islands and capes.
- Corrected issues with grib files imported by ZyGrib and UGrib.
ZyGrib and UGrib have their own servers producing compact grib 2 files.
ZyGrib files are further bz2 compressed.
These programs save the grib files to hard disk (Gribs contain the wind forecasts and other meteorological variables).
You can load those gribs in VRTool, using the NOAA import module.
1- Click [Load] and select the file.
* For UGrib search files with extension *.grb
* For ZyGrib search files with extension *.grb.bz2
Choose the file and click [Ok].
2- Click [Use Winds]. This will add the grid to vrtool desktop.
I found these files to be useful if you are sailing on a real boat with
restricted Internet access. Downloading data directly from NOAA
servers can be difficult if the connection is slow.
Also, by re-using the files, you save satellite bandwidth.
- Fixed some small problems. While not required, this update
is recommended.
------ Screen shots ------

Wind color field is similar to previous colored rectangles, but with higher resolution.
Better for interpolated winds

Low pressure areas (red) have fast winds. Green and blue areas are high pressures (calm)