To allow interoperability between different mapping applications,
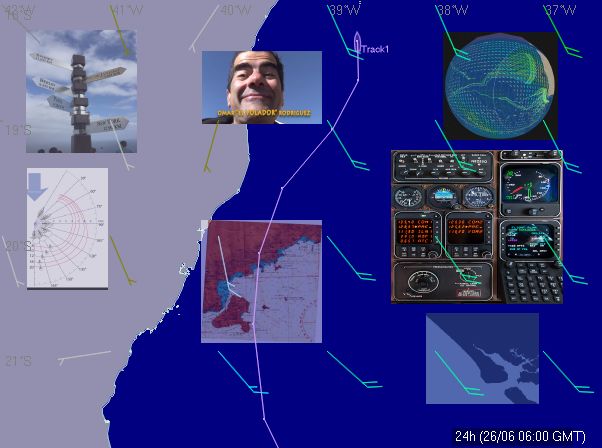
vrtool version 2.50 implements a new type of object: snapshots.
A snapshot associates an image to positional information.
The image is rendered to vrtool chart at the specified position and scale.
Import any map image (i.e. raster chart) and position it interactively
with the "snapshot tool".
The snap image is semi-transparent and combines with the
the vector chart underneath. Play with opacity.
If the snapshot contains a chart, you have to scale it
to make both charts fit.
Snap images can be:
- loaded from a disk file
- captured from the screen
+ To add a new snap:
1- go to "Snapshot" menu or group (tab Objects)
2- click "Add Snap" button. Snap edition form will show.
3- select image. Either:
* Click [Load] icon to open an existing file. Select jpg, png or bmp file. Click Ok.
Note that the filename field is now set.
* or Click [Capture] . This will hide VRTool and show the
Windows desktop below, with a cross-hair cursor.
Select the area you want to capture (left-click and drag the mouse
from top-left to bottom-right). Release mouse button to finish.
4- Set snap properties. Choose a meaningful name for the object.
Set options []Invert and []Mercator (see below)
5- {Optional} Save captured the image to disk (formats jpg, png or bmp)
This will make the snap persistent(i.e. saved to the desktop, see below).
6- Click Ok to accept.
Snap positioning steps:
1- Select the "snapshot tool". Click the snap in the chart to select it.
2- Use the 8 marks to move the image borders, scaling it.
Zoom-in to the corners to position the marks more precisely.
Drag the mouse from inside to move the whole snap.
Use Shift-ArrowKeys to move the snap 1 pixel in the 4 directions.
If the source chart has a grid, use it to match VRTool's.
Or match the shorelines close to the borders.
3- Once the image is positioned, Lock its movements to prevent
accidental displacement. Right-click the selected snap
to edit it and click the [Lock] button. Red lock means locked.
Some chart images are mostly white and don't go well with
VRTool's dark color style. Use the [x]Invert option to draw a negative image.
Some map images have non linear latitude scales.
Most nautical charts are Mercator projections. Also Google maps.
They will not quite fit near the center, even if the borders are ok.
In these cases set the [x]Mercator projection correction option.
If the image has a linear latitude scale, leave it unchecked.
For captured images, if the filename field is left empty,
the snap will not be saved to disk and will
vanish when you close VRTool. Use this "feature" to paste temporary snaps.
Snaps are useful for documentation of the leg. The screen capture ability
makes it easy to incorporate all sorts of maps, notes, sat photos,
weather forecasts and pet pictures to your desktop.
notes:
- Constantly resampling big maps is painful to your computer CPU
so avoid very large images.
- Images you capture by any means may be covered by copyrights.
Some user licenses forbid screen capturing of any kind.
- These charting features are not for actual NAVIGATION.
Use this software at your own risk (see user license)
Behave!
I did some changes to the way things are rendered in the program,
now using 3 layers: maps, winds and boats. By rendering only the
modified parts, it is supposed to be faster.
The former "Tracks" tab was renamed to "Objects".
Also grouped Tracks, Routes and Marks into Objects in the main menu.
Hope I did not break anything..
Go to download page
my Snaps

